 Emil Rydell Högelin1,2
 Kajsa Thulin1,3
 Ferdinand von Walden4,5Lotta Fornander1,6
 Piotr Michno1,7
 Björn Alkner1,3*
- 1Department of Biomedical and Clinical Sciences, Linköping University, Linköping, Sweden
- 2Futurum - Academy for Health and Care, Jönköping, Sweden
- 3Department of Orthopaedic Surgery, Eksjö, Jönköping, Sweden
- 4Department of Paediatrics, Karolinska University Hospital, Stockholm, Sweden
- 5Department of Women’s and Children’s Health, Karolinska Institutet, Stockholm, Sweden
- 6Department of Orthopedic Surgery, Norrköping, Sweden
- 7Department of Orthopaedic Surgery, Jönköping, Sweden
Introduction and aims: Accurate determination of skeletal muscle size is of great importance in multiple settings including resistance exercise, aging, disease, and disuse. Ultrasound (US) measurement of muscle thickness (MT) is a method of relatively high availability and low cost. The present study aims to evaluate a multisite ultrasonographic protocol for measurement of MT with respect to reproducibility and correlation to gold-standard measurements of muscle volume (MV) with magnetic resonance imaging (MRI) in children.
Material and methods: 15 children completed the study (11 ± 1 year, 41 ± 8 kg, 137 ± 35 cm). Following 20 min supine rest, two investigators performed US MT measurements of all four heads of the m. quadriceps femoris, at pre-determined sites. Subsequently, MRI scanning was performed and MV was estimated by manual contouring of individual muscle heads.
Results: Ultrasound measurement of MT had an intra-rater reliability of ICC = 0.985–0.998 (CI 95% = 0.972–0.998) and inter-rater reliability of ICC = 0.868–0.964 (CI 95% = 0.637–0.983). The US examinations took less than 15 min, per investigator. Muscle thickness of all individual quadriceps muscles correlated significantly with their corresponding MV as measured by MRI (overall r = 0.789, p < 0.001).
Conclusion: The results of this study indicate that US measurement of MT using a multisite protocol is a competitive alternative to MRI scanning, especially with respect to availability and time consumption. Therefore, US MT could allow for wider clinical and scientific implementation.
1 Introduction
An accurate determination of skeletal muscle mass is of great importance when investigating muscle adaptation during hypertrophy (Aagaard et al., 2001; Morse et al., 2005; D'Antona et al., 2006; Franchi et al., 2018) and atrophy (Abe et al., 1997; LeBlanc et al., 2000; Alkner and Tesch, 2004; Maurits et al., 2004; Rittweger et al., 2005; Petterson et al., 2008; Dirks et al., 2016; Johnson et al., 2018). Several methods for assessing or estimating skeletal muscle size have been described including bioimpedance (Salinari et al., 2002), computerized tomography (Van Roie et al., 2013), magnetic resonance imaging (MRI) (Walton et al., 1997; Alkner and Tesch, 2004; Nordez et al., 2009) and ultrasound (US) (Miyatani et al., 2002; Miyatani et al., 2004; Reeves et al., 2004; Sanada et al., 2006; Moreau et al., 2010; Baldwin et al., 2011; Scott et al., 2012; Strasser et al., 2013; Tillquist et al., 2014; Fukumoto et al., 2015; Giles et al., 2015; Nakatani et al., 2016; Hadda et al., 2017; Matta et al., 2017; Stock et al., 2017; Franchi et al., 2018; Pardo et al., 2018; Filippo et al., 2019; Mechelli et al., 2019; Cheon et al., 2020; Betz et al., 2021; Lee et al., 2021; Mpampoulis et al., 2021; Takahashi et al., 2021). Muscle volume (MV) estimated from multiple cross-sectional areas (CSA) using MRI is considered the current gold standard, however, this process is time consuming and labor-intensive (Nordez et al., 2009), therefore the feasibility of MRI is limited, especially for repeated measurements in large cohorts. Alternatives like computerized tomography could also be utilized, however, the exposure to ionizing radiation makes it unsuitable, especially for children (Nakayama et al., 2019). On the contrary, ultrasonography (US) is a method that allows quick and mobile scanning at a low cost without ionizing radiation.
For a protocol of US scanning to be useful, it needs to be reliable throughout repeated scans (i.e., intra and inter-rater reliability) (Hadda et al., 2017; Pardo et al., 2018; Filippo et al., 2019; Takahashi et al., 2021) and be valid to reference modalities (i.e., MRI-estimated MV) (Miyatani et al., 2002; Miyatani et al., 2004; Franchi et al., 2018; Liegnell et al., 2021). However, the literature is mainly focused on measuring the Muscle thickness (MT) of m. rectus femoris (RF) and to some extent, the thickness of m. vastus intermedius (VI) underneath (Moreau et al., 2010; Galindo Martín et al., 2017; Hadda et al., 2017; Pardo et al., 2018; Takahashi et al., 2021). Some have investigated the other muscles of the m. quadriceps femoris (QF) (Moreau et al., 2010; Franchi et al., 2018; Cheon et al., 2020; Betz et al., 2021; Mpampoulis et al., 2021), and others have utilized a multisite approach, measuring all the individual muscles of the QF (Cadore et al., 2012; Strasser et al., 2013; Matta et al., 2017; Santos and Armada-da-Silva, 2017; Lee et al., 2021). These studies utilized varying methodologies, and none have provided conclusive evidence of both validity, compared to MRI, and intra and inter-rater reliability. Consequently, data on both reliability and validity of an easy-to-use US scanning protocol encompassing all heads of the QF is lacking, especially in children. Children, especially pre-pubertal, could have differing muscle distribution and properties compared to adults, however, data regarding this is to our knowledge lacking.
We aimed to establish a time-effective ultrasound method for determining MT of all four heads of the QF, that is, applicable to children and correlates to MRI-measured MV. We hypothesized that such a protocol could be reliably performed by two independent investigators and that the results would have a strong correlation to MRI-measured muscle volume.
2 Material and Methods
2.1 Participants
Fifteen healthy children (7 females and 8 males) with mean age, body mass, and height ±SD of 11 ± 1 year, 41 ± 8 kg and 137 ± 35 cm, were included. Recruitment was carried out at a local primary school with children aged 10–12 years in Eksjö, Sweden. The children volunteered to participate in a pilot study focusing on resistance exercise in children, including bilateral US and MRI examinations of the thigh. Informed assent was obtained from the children, after receiving age-appropriate information. The legal guardians provided both written and verbal informed consent. The study was approved by the Swedish Ethical Review Authority (EPM DNR: 2020-07112) and was conducted in accordance with the Declaration of Helsinki.
2.2 General Design
The participants underwent US followed by MRI on the same occasion. All participants were instructed to refrain from heavy sports, exercise, and physical education 24 h prior to MRI and US scanning. Prior to the US and MRI all participants remained in supine rest for a minimum of 20 min to avoid differences in muscle size due to skeletal muscle fluid shifts caused by gravitational forces (Berg et al., 1993). The participants were transported in the supine position from US to the MRI facility.
2.3 Ultrasound
A b-mode ultrasound machine (FlexFocus 500, BK Medical, Herlev, Denmark) was used with fixed settings (Db = 75, mHz = 15, Hz = 3/26) for all ultrasound examinations, only the depth was altered. A linear probe (Linear Array 8670, BK Medical) was used with the ultrasound machine. Images were stored directly on the machine. During scanning, participants remained relaxed in a supine position, feet fixed in a u-shaped pillow (Lassekudde, Solann, Stockholm, Sweden). Great care was taken to eliminate tissue compression by the probe, ensured using ample amounts of water-soluble transmission gel and the preservation of an intact curvature of the skin. The ultrasonographic investigation was performed by two investigators with limited previous sonographic experience. However, they underwent training for approximately 3 h prior to this study by an experienced sonographer.
The probe was placed in an axial orientation, perpendicular to the quadriceps femoris muscle. The points of measurement were performed at set intervals along the axis derived from measuring the distance from spina iliaca anterior superior (SIAS) to the proximal edge of patella.
During initial pre-study trials, the inter-rater reliability of SIAS to patella measurement was deemed to have sufficient reproducibility. Furthermore, in our planned future implementation we intend to utilize a guiding ink-marking in-between measurements. Therefore, the same measurement of SIAS to patella was used. However, each of the investigators performed independent measurement of the distance. Both legs were scanned during the same session. Muscles measured were m. rectus femoris (RF), m. vastus lateralis (VL), m. vastus intermedius (VI), and m. vastus medialis (VM), exact measurement sites are shown in Table 1. The point of measurement for RF (Giles et al., 2015; Stock et al., 2017; Pardo et al., 2018; Cheon et al., 2020; Takahashi et al., 2021), VI (Giles et al., 2015; Cheon et al., 2020), VL (Giles et al., 2015) and VM (Giles et al., 2015) were derived from previous literature and experience from pretesting. At each of the measuring sites three pictures were taken and evaluated. If the variance of MT exceeded 10 percent, measured from the lowest value to the highest one, additional measurements were taken. Measurements varying more than 10 percent of the mean were excluded. This process was repeated until three values not exceeding the 10 percent threshold were acquired. Measurements of MT were performed directly during the scanning in machine native software, Figure 1.
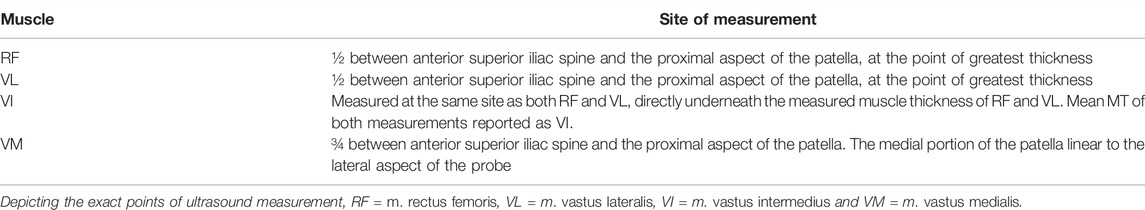
TABLE 1. Sites of measurement and muscles measured at each site.
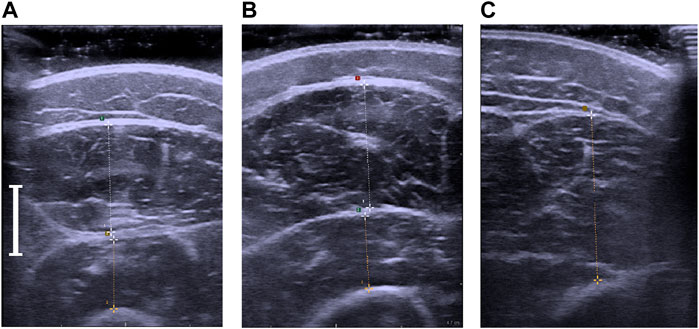
FIGURE 1. (A). Ultrasonographic measurement of the m. rectus femoris and m. vastus intermedius. (B) Ultrasonographic measurement of the m. vastus lateralis and m. vastus intermedius. (C) Ultrasonographic measurement of the m. vastus medialis. The white indicator shows the length of 1 cm.
2.4 Magnetic Resonance Imaging
All the participating children tolerated the MRI scan without any discomfort. During scanning, participants were placed in a similar position to that used during ultrasound scans. An initial scout image was taken to identify the area of interest, from SIAS to tibiofemoral articulating surfaces of the knee joint. The scans were performed using a 1.5 T MRI scanner (Siemens Symphony Tim, Munich, Germany) to acquire 52 slices of axial images. One T1-weighted scan was performed using the following settings: Field of view 400 mm, repetition time = 637 ms, echo time = 12 ms, voxel size = 1.7 × 1.3 × 7.0 mm, slice thickness = 7.0 mm and interslice thickness = 1.4 mm.
2.4.1 Postprocessing
Image processing was performed in Osirix lite (Pixmeo, Geneva, Switzerland) for manual identification of the quadriceps muscle and contouring. Contouring was performed using a drawing tablet and pen (Wacom Intuos M, Wacom, Saitama, Japan). Contours of RF, VM, VI, and VL were drawn individually, Figure 2. We aimed to contour only muscle tissue and care was taken to exclude the fascia. No consideration for intramuscular non-contractile tissue (e.g., fat) was taken. Every second MRI slice was contoured. Determination of MV was performed using Cavalieri’s approximation (Walton et al., 1997; Nordez et al., 2009), Eq. (1).
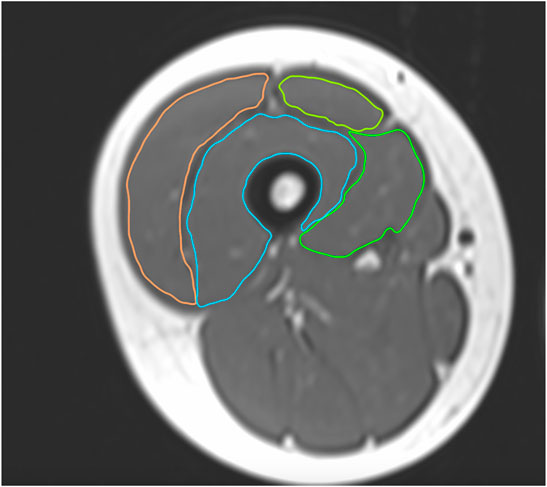
FIGURE 2. The contouring process of the m. quadriceps femoris for MV estimation of the individual muscle heads.
A total of 623 unilateral MRI slices were contoured at a pace of approximately 40 slices per hour. Most slices included all four heads of the QF. However, for the most proximal portion of the thigh, mainly RF was detected and in the distal aspect of the thigh, only VM was delineated.
2.5 Intra- and Inter-Rater Reproducibility of Ultrasound Scanning and Magnetic Resonance Imaging Postprocessing
Two investigators performed ultrasound scans on all the participants in a standardized fashion as previously described. Intra-rater reproducibility was calculated from the three separate scans performed in the same session. Inter-rater reproducibility was calculated from the mean of both investigators’ measurement of each muscle.
The postprocessing, i.e., contouring of MRI images, was performed by one investigator. Intra-rater reliability was calculated from repeated contouring of 10 percent of total slices (n = 63), randomly selected. Both measurements were performed by the same contourer but separated in time by over a month.
2.6 Statistics
The statistical analyses were performed using SPSS statistics 27 (IBM, Armonk, NY, 2020). Initially, descriptive statistics were used to characterize the dataset. Thereafter, intraclass correlation coefficient (ICC) was calculated to identify reproducibility between repeated measurements, between sonographers. A two-way mixed model, single measures and absolute agreement were used for the evaluation of inter-rater reproducibility. A two-way mixed model, average measures and absolute agreement was used to evaluate intra-rater reproducibility. Intraclass correlation coefficient values were interpreted by the ranges defined by Koo et al. (Koo and Li, 2016). Standard error of measurement (SEM) and minimal detectable change (MDC) was calculated from standard deviation and ICC as described by Filippo et al. (Filippo et al., 2019). Initial descriptive statistics showed that multiple variables had a non-normally distributed pattern. Therefore, Spearman correlation was used to allow for comparisons between non-normally distributed and normally distributed variables. Values of p < 0.05 were considered significant.
3 Results
3.1 Ultrasonography
Ultrasonographic scanning and measurements of both thighs took less than 15 min per investigator and participant. Out of a total of 450 measurements (three measurement sites, five measurements in total, three repetitions, two limbs and 15 participants), 20 measurements exceeded >10% variance in range and were hence excluded, this accounted for 4.4% of the total measurements. Intraclass correlations between the two investigators measurements of the SIAS-patella distance was ICC = 0.936 (CI 95% 0.860–0.966). Mean values of measured MT per muscle and investigator are shown in Table 2, complemented by the mean range of the repeated measurements and the intra- and inter-rater reliability measured by ICC. The agreement of the two investigators regarding total MT is depicted in Figure 3.
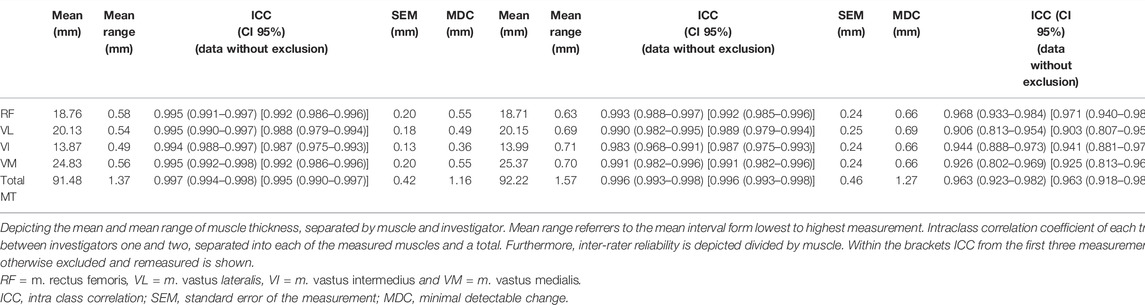
TABLE 2. Intra- and inter-rater reliability of US scanning.
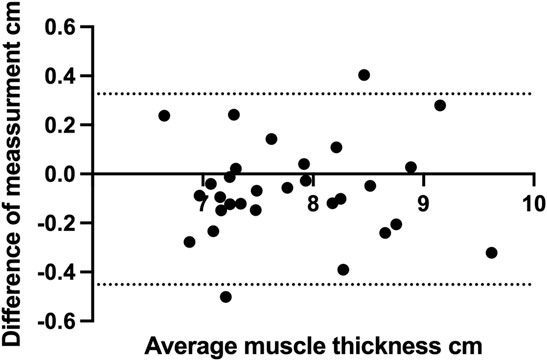
FIGURE 3. Bland-Altman graph depicting the difference between the two investigators in respect to total muscle thickness measured by ultrasound.
3.2 Magnetic Resonance Imaging
The mean MV calculated by Cavalieri’s approximation is depicted in Figure 4. The VI and VL had the largest total volume closely followed by the VM, while RF had a smaller volume. The muscles also had differing dominant portions along the length of the thigh, shown in Figure 5. Repeated contouring of CSA had an ICC of 0.983 compared to initial contouring, indicative of a high degree of agreement.
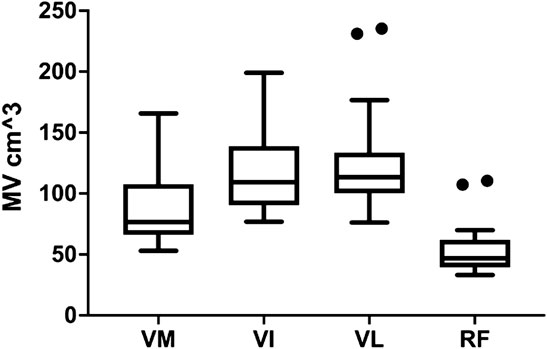
FIGURE 4. The muscle volume of VM, VI, VL and RF. The horizontal line shows the median, while the box encompasses the 50th percentile and the whiskers encompass the minimum and maximum values, outliers are displayed as points. Outliers are defined according to Tukey, as values exceeding more than the 75 percentile plus 1.5 IQR. RF = m. rectus femoris, VL = m. vastus lateralis, VI = m. vastus intermedius and VM = m. vastus medialis.
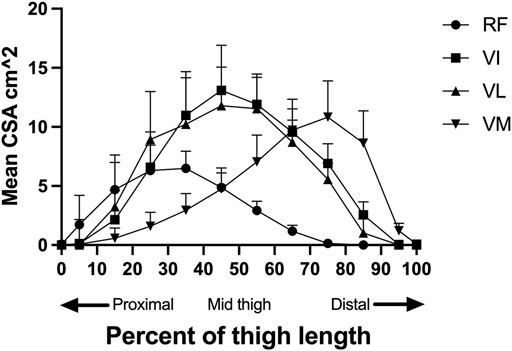
FIGURE 5. The distribution of mean muscle area of each group (RF, VI, VL, VM) along the length of the thigh, standardized for length. The standard deviation is depicted by the error bars. The first percentile is the most proximal slice where RF was still identifiable, and the one hundred percentile is the most distal slice where m. Vastus Medialis is still identifiable. RF = m. rectus femoris, VL = m. vastus lateralis, VI = m. vastus intermedius, VM = m. vastus medialis and CSA= Cross-sectional area.
3.3 Inter-Modality Correlation
Ultrasonographic measurements of MT had a correlation ranging from r = 0.514 to 0.789 with respect to their corresponding MV measured by MRI, Table 3. The total MRI MV to total US MT had the strongest correlation, shown in Figure 6. The same analysis was also performed using only the first US measurement of MT, including outliers, to evaluate the value of repeated scanning during the session, Table 3.
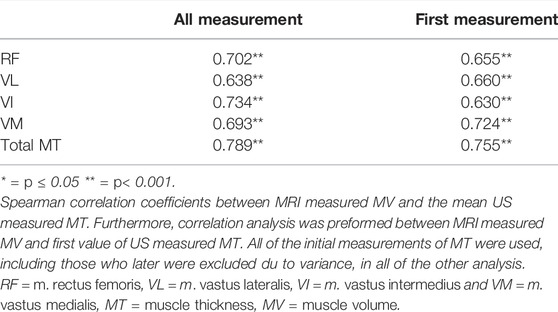
TABLE 3. Correlation between MV and MT.
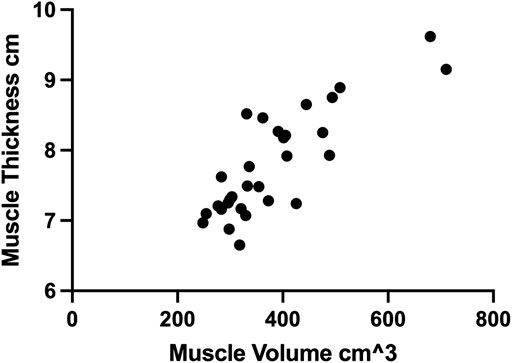
FIGURE 6. The correlation between total muscle thickness of each limb measured by ultrasound and the corresponding muscle volume measured by MRI.
4 Discussion
The present study shows that this multisite protocol of ultrasonographic assessment of quadriceps MT can be reproduced in a reliable manner in children, supporting results from previous studies in adults (Miyatani et al., 2004; Sanada et al., 2006; Franchi et al., 2018). Our approach proved feasible to perform within a limited time frame and was easy to conduct for investigators with limited prior ultrasonographic experience. This multisite ultrasonographic protocol had a high intra- and inter-rater reliability and a strong correlation to MV measured with MRI.
Intra-rater reliability for the US measure of MT was within the “good” and “excellent” range (Koo and Li, 2016). The ICC values varied for the different muscles; however, the confidence intervals were overlapping. The current study presents a good to excellent inter-rater reliability, in line to those of previous studies (Tillquist et al., 2014; Zaidman et al., 2014; Hadda et al., 2017; Filippo et al., 2019; Mechelli et al., 2019; Betz et al., 2021; Takahashi et al., 2021). However, variations in methodology including site(s), time in-between measurements and number of measurements make direct comparisons difficult.
The ultrasonographically measured MT correlated strongly to the corresponding MRI-measured MV, similar to those of previous studies (Miyatani et al., 2002; Miyatani et al., 2004; Nakatani et al., 2016; Franchi et al., 2018). However, none of these studies employed a multisite measuring approach, thus not providing a sufficient framework of whole QF measurements to directly compare and evaluate this protocol with. Consequently, this study provides new unique results regarding the correlation of a multisite MT protocol of the m. quadriceps femoris to its MV.
The difference using only the first US measurement of MT instead of the mean of three after exclusion of outliers proved to be less substantial, the number of measurements could potentially be reduced and still maintain a sufficient correlation to MRI MV. A similar trend can be seen using only the first three measurements without exclusion of outliers for the reliability tests, Table 2, indicating that exclusion of outliers also had a less substantial effect.
Interestingly, m. rectus femoris had the smallest range of MV, Figure 3, indicating that it might constitute fundamentally different properties than the other vasti muscles. Previous studies have also shown that the RF has unique properties, as a two-joint muscle, regarding hypertrophy and activation compared to the other vasti muscles (Ema et al., 2013; Earp et al., 2015; Mangine et al., 2018). The present literature has primarily focused on RF MT and thus further studies investigating the other quadriceps are warranted.
A large aspect of the applicability of this protocol is to follow changes to specific stimuli over time, such as resistance exercise-induced hypertrophy. In this specific scenario, the value of estimating MRI measured MV is of less interest than capturing the change over time. Therefore, studies investigating repeated multisite US-measured MT over time, during the course of muscle adaptation and comparing it to MRI-measured CSA and MV, would be of great value.
5 Limitations
Intra-rater testing was performed in the same session, while care was taken to remove the probe from the thigh in-between measurements, a potential risk of bias remains. The use of the same measuring point between SIAS and patella, resulted in a potential bias since the investigators were not fully independent from each other’s measurements. The population investigated in this study was limited to healthy children aged 10–12 years, however, we believe this protocol would be applicable in an adult as well populations suffering from myopathology, although, this should be further confirmed.
6 Conclusion
This study presents a multisite ultrasound protocol for determination of quadriceps muscle thickness that has high inter-rater reliability and a strong correlation to MRI-measured MV. This method represents a possible alternative to MRI in settings where MRI scanning is not feasible due to time and/or financial constraints. In the case of limited resources and demand for longitudinal follow-up, multisite ultrasonographic MT measurements may represent a solid alternative.
Data Availability Statement
The raw data supporting the conclusions of this article will be made available by the authors, without undue reservation.
Ethics Statement
The studies involving human participants were reviewed and approved by the Swedish Ethical Review Authority (EPM DNR: 2020-07112). Written informed consent to participate in this study was provided by the participants’ legal guardian/next of kin.
Author Contributions
EH conducted study design, preparation and data gathering, data analysis and drafted the manuscript, KT conducted study design, preparation and data gathering, FvW conducted study design and preparation, LF conducted study design and preparation, PM conducted study design and preparation, BA conducted study design, preparation and data gathering. All authors read, edited, and approved of the final manuscript.
Funding
The project was funded by FORSS (Research Council of Southeast Sweden; FORSS-941020) and Futurum—Academy for Health and Care, Region Jönköping County, Sweden (Futurum-942394 and 942396).
Conflict of Interest
The authors declare that the research was conducted in the absence of any commercial or financial relationships that could be construed as a potential conflict of interest.
Publisher’s Note
All claims expressed in this article are solely those of the authors and do not necessarily represent those of their affiliated organizations, or those of the publisher, the editors and the reviewers. Any product that may be evaluated in this article, or claim that may be made by its manufacturer, is not guaranteed or endorsed by the publisher.
Acknowledgments
First and foremost, thanks to the children from Norrtullskolan primary school in Eksjö participating and for making this whole project possible. Further thanks to Helena Hjalmarsson and Sofia Carlbom for performing MRI scanning. Finally, thanks to Bo Rolander for assistance with the statistical analysis.
References
Aagaard P., Andersen J. L., Dyhre-Poulsen P., Leffers A.-M., Wagner A., Magnusson S. P., et al. (2001). A Mechanism for Increased Contractile Strength of Human Pennate Muscle in Response to Strength Training: Changes in Muscle Architecture. J. Physiol. 534, 613–623. doi:10.1111/j.1469-7793.2001.t01-1-00613.x
Abe T., Kawakami Y., Suzuki Y., Gunji A., Fukunaga T. (1997). Effects of 20 Days Bed Rest on Muscle Morphology. J. Gravit. Physiol. 4, S10–S14.
Alkner B. r. A., Tesch P. A. (2004). Knee Extensor and Plantar Flexor Muscle Size and Function Following 90 Days of Bed Rest with or without Resistance Exercise. Eur. J. Appl. Physiol. 93, 294–305. doi:10.1007/s00421-004-1172-8
Baldwin C. E., Paratz J. D., Bersten A. D. (2011). Diaphragm and Peripheral Muscle Thickness on Ultrasound: Intra-rater Reliability and Variability of a Methodology Using Non-standard Recumbent Positions. Respirology 16, 1136–1143. doi:10.1111/j.1440-1843.2011.02005.x
Berg H. E., Tedner B., Tesch P. A. (1993). Changes in Lower Limb Muscle Cross-Sectional Area and Tissue Fluid Volume after Transition from Standing to Supine. Acta Physiol. Scand. 148, 379–385. doi:10.1111/j.1748-1716.1993.tb09573.x
Betz T., Wehrstein M., Preisner F., Bendszus M., Friedmann-Bette B. (2021). Reliability and Validity of a Standardised Ultrasound Examination Protocol to Quantify Vastus Lateralis Muscle. J. Rehabil. Med. 53, jrm00212. doi:10.2340/16501977-2854
Cadore E. L., Izquierdo M., Conceição M., Radaelli R., Pinto R. S., Baroni B. M., et al. (2012). Echo Intensity Is Associated with Skeletal Muscle Power and Cardiovascular Performance in Elderly Men. Exp. Gerontol. 47, 473–478. doi:10.1016/j.exger.2012.04.002
Cheon S., Lee J.-H., Jun H.-P., An Y. W., Chang E. (2020). Acute Effects of Open Kinetic Chain Exercise versus Those of Closed Kinetic Chain Exercise on Quadriceps Muscle Thickness in Healthy Adults. Ijerph 17, 4669. doi:10.3390/ijerph17134669
D'antona G., Lanfranconi F., Pellegrino M. A., Brocca L., Adami R., Rossi R., et al. (2006). Skeletal Muscle Hypertrophy and Structure and Function of Skeletal Muscle Fibres in Male Body Builders. J. Physiol. 570, 611–627. doi:10.1113/jphysiol.2005.101642
Dirks M. L., Wall B. T., Van De Valk B., Holloway T. M., Holloway G. P., Chabowski A., et al. (2016). One Week of Bed Rest Leads to Substantial Muscle Atrophy and Induces Whole-Body Insulin Resistance in the Absence of Skeletal Muscle Lipid Accumulation. Diabetes 65, 2862–2875. doi:10.2337/db15-1661
Earp J. E., Newton R. U., Cormie P., Blazevich A. J. (2015). Inhomogeneous Quadriceps Femoris Hypertrophy in Response to Strength and Power Training. Med. Sci. Sports Exerc 47, 2389–2397. doi:10.1249/mss.0000000000000669
Ema R., Wakahara T., Miyamoto N., Kanehisa H., Kawakami Y. (2013). Inhomogeneous Architectural Changes of the Quadriceps Femoris Induced by Resistance Training. Eur. J. Appl. Physiol. 113, 2691–2703. doi:10.1007/s00421-013-2700-1
Filippo M., Lars A.-N., Maria S., Sandra A.-B. (2019). Inter-rater and Intra-rater Reliability of Ultrasound Imaging for Measuring Quadriceps Muscle and Non-contractile Tissue Thickness of the Anterior Thigh. Biomed. Phys. Eng. Express 5, 037002. doi:10.1088/2057-1976/ab102f
Franchi M. V., Longo S., Mallinson J., Quinlan J. I., Taylor T., Greenhaff P. L., et al. (2018). Muscle Thickness Correlates to Muscle Cross-Sectional Area in the Assessment of Strength Training-Induced Hypertrophy. Scand. J. Med. Sci. Sports 28, 846–853. doi:10.1111/sms.12961
Fukumoto Y., Ikezoe T., Yamada Y., Tsukagoshi R., Nakamura M., Takagi Y., et al. (2015). Age-Related Ultrasound Changes in Muscle Quantity and Quality in Women. Ultrasound Med. Biol. 41, 3013–3017. doi:10.1016/j.ultrasmedbio.2015.06.017
Galindo Martín C. A., Monares Zepeda E., Lescas Méndez O. A. (2017). Bedside Ultrasound Measurement of Rectus Femoris: A Tutorial for the Nutrition Support Clinician. J. Nutr. Metab. 2017, 2767232.
Giles L. S., Webster K. E., Mcclelland J. A., Cook J. (2015). Can Ultrasound Measurements of Muscle Thickness Be Used to Measure the Size of Individual Quadriceps Muscles in People with Patellofemoral Pain? Phys. Ther. Sport 16, 45–52. doi:10.1016/j.ptsp.2014.04.002
Hadda V., Khilnani G. C., Kumar R., Dhunguna A., Mittal S., Khan M. A., et al. (2017). Intra- and Inter-observer Reliability of Quadriceps Muscle Thickness Measured with Bedside Ultrasonography by Critical Care Physicians. Indian J. Crit. Care Med. 21, 448–452. doi:10.4103/ijccm.IJCCM_426_16
Johnson R. W., Ng K. W. P., Dietz A. R., Hartman M. E., Baty J. D., Hasan N., et al. (2018). Muscle Atrophy in Mechanically-Ventilated Critically Ill Children. PLoS One 13, e0207720. doi:10.1371/journal.pone.0207720
Koo T. K., Li M. Y. (2016). A Guideline of Selecting and Reporting Intraclass Correlation Coefficients for Reliability Research. J. Chiropr. Med. 15, 155–163. doi:10.1016/j.jcm.2016.02.012
Leblanc A., Lin C., Shackelford L., Sinitsyn V., Evans H., Belichenko O., et al. (20001985). Muscle Volume, MRI Relaxation Times (T2), and Body Composition after Spaceflight. J. Appl. Physiology 89, 2158–2164. doi:10.1152/jappl.2000.89.6.2158
Lee H.-J., Lee K.-W., Takeshi K., Lee Y.-W., Kim H.-J. (2021). Correlation Analysis between Lower Limb Muscle Architectures and Cycling Power via Ultrasonography. Sci. Rep. 11, 1–12. doi:10.1038/s41598-021-84870-x
Liegnell R., Wessman F., Shalabi A., Harringe M. (2021). Validity of Ultrasonography-Derived Predictions for Estimating Skeletal Muscle Volume: a Systematic Literature Review. BMC Med. Imaging 21, 106. doi:10.1186/s12880-021-00638-9
Mangine G. T., Redd M. J., Gonzalez A. M., Townsend J. R., Wells A. J., Jajtner A. R., et al. (2018). Resistance Training Does Not Induce Uniform Adaptations to Quadriceps. PLoS One 13, e0198304. doi:10.1371/journal.pone.0198304
Matta T. T., Nascimento F. X., Trajano G. S., Simão R., Willardson J. M., Oliveira L. F. (2017). Selective Hypertrophy of the Quadriceps Musculature after 14 Weeks of Isokinetic and Conventional Resistance Training. Clin. Physiol. Funct. Imaging 37, 137–142. doi:10.1111/cpf.12277
Maurits N. M., Beenakker E. A. C., Van Schaik D. E. C., Fock J. M., Van Der Hoeven J. H. (2004). Muscle Ultrasound in Children: Normal Values and Application to Neuromuscular Disorders. Ultrasound Med. Biol. 30, 1017–1027. doi:10.1016/j.ultrasmedbio.2004.05.013
Mechelli F., Arendt-Nielsen L., Stokes M., Agyapong-Badu S. (2019). Validity of Ultrasound Imaging versus Magnetic Resonance Imaging for Measuring Anterior Thigh Muscle, Subcutaneous Fat, and Fascia Thickness. Methods Protoc. 2. doi:10.3390/mps2030058
Miyatani M., Kanehisa H., Ito M., Kawakami Y., Fukunaga T. (2004). The Accuracy of Volume Estimates Using Ultrasound Muscle Thickness Measurements in Different Muscle Groups. Eur. J. Appl. Physiol. 91, 264–272. doi:10.1007/s00421-003-0974-4
Miyatani M., Kanehisa H., Kuno S., Nishijima T., Fukunaga T. (2002). Validity of Ultrasonograph Muscle Thickness Measurements for Estimating Muscle Volume of Knee Extensors in Humans. Eur. J. Appl. Physiol. 86, 203–208. doi:10.1007/s00421-001-0533-9
Moreau N. G., Simpson K. N., Teefey S. A., Damiano D. L. (2010). Muscle Architecture Predicts Maximum Strength and Is Related to Activity Levels in Cerebral Palsy. Phys. Ther. 90, 1619–1630. doi:10.2522/ptj.20090377
Morse C. I., Thom J. M., Mian O. S., Muirhead A., Birch K. M., Narici M. V. (2005). Muscle Strength, Volume and Activation Following 12-month Resistance Training in 70-Year-Old Males. Eur. J. Appl. Physiol. 95, 197–204. doi:10.1007/s00421-005-1342-3
Mpampoulis T., Methenitis S., Papadopoulos C., Papadimas G., Spiliopoulou P., Stasinaki A.-N., et al. (2021). Weak Association between Vastus Lateralis Muscle Fiber Composition and Fascicle Length in Young Untrained Females. Sports 9, 56. doi:10.3390/sports9050056
Nakatani M., Takai Y., Akagi R., Wakahara T., Sugisaki N., Ohta M., et al. (2016). Validity of Muscle Thickness-Based Prediction Equation for Quadriceps Femoris Volume in Middle-Aged and Older Men and Women. Eur. J. Appl. Physiol. 116, 2125–2133. doi:10.1007/s00421-016-3464-1
Nakayama T., Ishiyama A., Murakami T., Kimura E., Kuru S. (2019). Automatic Calculation of Mercuri Grades from CT and MR Muscle Images. Brain Dev. 41, 870–877. doi:10.1016/j.braindev.2019.06.008
Nordez A., Jolivet E., Südhoff I., Bonneau D., De Guise J. A., Skalli W. (2009). Comparison of Methods to Assess Quadriceps Muscle Volume Using Magnetic Resonance Imaging. J. Magn. Reson. Imaging 30, 1116–1123. doi:10.1002/jmri.21867
Pardo E., El Behi H., Boizeau P., Verdonk F., Alberti C., Lescot T. (2018). Reliability of Ultrasound Measurements of Quadriceps Muscle Thickness in Critically Ill Patients. BMC Anesthesiol. 18, 205. doi:10.1186/s12871-018-0647-9
Petterson S. C., Barrance P., Buchanan T., Binder-Macleod S., Snyder-Mackler L. (2008). Mechanisms Underlying Quadriceps Weakness in Knee Osteoarthritis. Med. Sci. Sports Exerc 40, 422–427. doi:10.1249/mss.0b013e31815ef285
Reeves N. D., Maganaris C. N., Narici M. V. (2004). Ultrasonographic Assessment of Human Skeletal Muscle Size. Eur. J. Appl. Physiology 91, 116–118. doi:10.1007/s00421-003-0961-9
Rittweger J., Frost H., Schiessl H., Ohshima H., Alkner B., Tesch P., et al. (2005). Muscle Atrophy and Bone Loss after 90 Days' Bed Rest and the Effects of Flywheel Resistive Exercise and Pamidronate: Results from the LTBR Study. Bone 36, 1019–1029. doi:10.1016/j.bone.2004.11.014
Salinari S., Bertuzzi A., Mingrone G., Capristo E., Pietrobelli A., Campioni P., et al. (2002). New Bioimpedance Model Accurately Predicts Lower Limb Muscle Volume: Validation by Magnetic Resonance Imaging. Am. J. Physiology-Endocrinology Metabolism 282, E960–E966. doi:10.1152/ajpendo.00109.2001
Sanada K., Kearns C. F., Midorikawa T., Abe T. (2006). Prediction and Validation of Total and Regional Skeletal Muscle Mass by Ultrasound in Japanese Adults. Eur. J. Appl. Physiol. 96, 24–31. doi:10.1007/s00421-005-0061-0
Santos R., Armada-Da-Silva P. A. S. (2017). Reproducibility of Ultrasound-Derived Muscle Thickness and Echo-Intensity for the Entire Quadriceps Femoris Muscle. Radiography 23, e51–e61. doi:10.1016/j.radi.2017.03.011
Scott J. M., Martin D. S., Ploutz-Snyder R., Caine T., Matz T., Arzeno N. M., et al. (2012). Reliability and Validity of Panoramic Ultrasound for Muscle Quantification. Ultrasound Med. Biol. 38, 1656–1661. doi:10.1016/j.ultrasmedbio.2012.04.018
Stock M. S., Mota J. A., Hernandez J. M., Thompson B. J. (2017). Echo Intensity and Muscle Thickness as Predictors of Athleticism and Isometric Strength in Middle-School Boys. Muscle Nerve 55, 685–692. doi:10.1002/mus.25395
Strasser E. M., Draskovits T., Praschak M., Quittan M., Graf A. (2013). Association between Ultrasound Measurements of Muscle Thickness, Pennation Angle, Echogenicity and Skeletal Muscle Strength in the Elderly. Age 35, 2377–2388. doi:10.1007/s11357-013-9517-z
Takahashi Y., Fujino Y., Miura K., Toida A., Matsuda T., Makita S. (2021). Intra- and Inter-rater Reliability of Rectus Femoris Muscle Thickness Measured Using Ultrasonography in Healthy Individuals. Ultrasound J. 13, 21. doi:10.1186/s13089-021-00224-8
Tillquist M., Kutsogiannis D. J., Wischmeyer P. E., Kummerlen C., Leung R., Stollery D., et al. (2014). Bedside Ultrasound Is a Practical and Reliable Measurement Tool for Assessing Quadriceps Muscle Layer Thickness. JPEN J. Parenter. Enter. Nutr. 38, 886–890. doi:10.1177/0148607113501327
Van Roie E., Delecluse C., Coudyzer W., Boonen S., Bautmans I. (2013). Strength Training at High versus Low External Resistance in Older Adults: Effects on Muscle Volume, Muscle Strength, and Force-Velocity Characteristics. Exp. Gerontol. 48, 1351–1361. doi:10.1016/j.exger.2013.08.010
Walton J. M., Roberts N., Whitehouse G. H. (1997). Measurement of the Quadriceps Femoris Muscle Using Magnetic Resonance and Ultrasound Imaging. Br. J. Sports Med. 31, 59–64. doi:10.1136/bjsm.31.1.59
Keywords: ultrasonography, skeletal muscle, children, magnetic resonance imaging, hypertrophy, atrophy
Citation: Högelin ER, Thulin K, von Walden F, Fornander L, Michno P and Alkner B (2022) Reliability and Validity of an Ultrasound-Based Protocol for Measurement of Quadriceps Muscle Thickness in Children. Front. Physiol. 13:830216. doi: 10.3389/fphys.2022.830216
Received: 06 December 2021; Accepted: 06 June 2022;
Published: 27 June 2022.
Edited by:
Emiliano Cè, University of Milan, ItalyReviewed by:
Marco Alessandro Minetto, University of Turin, ItalyFeza Korkusuz, Hacettepe University, Turkey
Copyright © 2022 Högelin, Thulin, von Walden, Fornander, Michno and Alkner. This is an open-access article distributed under the terms of the Creative Commons Attribution License (CC BY). The use, distribution or reproduction in other forums is permitted, provided the original author(s) and the copyright owner(s) are credited and that the original publication in this journal is cited, in accordance with accepted academic practice. No use, distribution or reproduction is permitted which does not comply with these terms.
*Correspondence: Björn Alkner, bjorn.alkner@liu.se