
Abstract
Coronary flow rate remains complex to assess in clinical practice using non-invasive, non-ionizing imaging tools. In this study, we introduce 3D ultrafast Doppler coronary angiography (3D UDCA), an ultrasound-based method to assess coronary blood flows in three-dimensions at high volume-rate and in one single heartbeat. We demonstrate that 3D UDCA can visualize the coronary vasculature with high temporal and spatial resolution and quantify the absolute flow. The feasibility of the technique was demonstrated in an open-chest swine model. The flow rate of the left-anterior descending artery (LAD) assessed by 3D UDCA was reconstructed successfully at the early diastolic and late diastolic phases and was in good agreement with an invasive gold-standard flowmeter during baseline, reactive hyperemia and coronary stenosis (r2 = 0.84). Finally, we demonstrate that a coronary stenosis on the LAD can be visualized as well as its associated flow acceleration.
Export citation and abstract BibTeX RIS

Original content from this work may be used under the terms of the Creative Commons Attribution 3.0 licence. Any further distribution of this work must maintain attribution to the author(s) and the title of the work, journal citation and DOI.
1. Introduction
Coronary arteries ensure cardiac perfusion and changes in coronary flow have serious consequences on the heart's performance, as observed in the case of stable angina or myocardial infarction (Camici et al 2015). Invasive Coronary Angiography (ICA) remains the reference technique for investigating coronary lesions in case of suspected ischemia (Montalescot et al 2013) because it can provide both anatomical and functional assessment of the coronary vessel. Narrowing of large arteries are directly visualized on the angiogram whereas the coronary function is assessed by measuring the pressure or the flow velocity in the coronary artery in order to derive the Fractional Flow Reserve (FFR) or the Coronary Flow Reserve (CFR) (Montalescot et al 2013). Functional evaluation by ICA is a major tool for clinical decision-making in ischemic heart disease (Gould et al 2013, Montalescot et al 2013). Nevertheless, ICA is invasive and involves relatively rare but considerable risks for the patients such as death, myocardial infarction and stroke (Noto et al 1991, Fihn et al 2015).
Significant progress has been made over the past few years in non-invasive imaging of the coronary arteries with computed Cardiac Magnetic Resonance Imaging (Henningsson et al 2017) or computed tomography coronary angiography (CTA) (Hoffmann et al 2005) but these modalities remain limited to the exploration of the anatomy of large coronary arteries. The emergence of FFR-CTA (Lu et al 2017) offers new possibilities for functional investigations, but this tool relies on indirect numerical computation, is ionizing and requires the injection of contrast agents in the blood flow.
In peripheral arterial territories, Doppler ultrasound imaging has supplanted arterial angiography due to the advantages of a non-invasive and non-ionizing imaging technique (Pinto et al 1996, Vit et al 2003). In cardiac applications, however, Doppler imaging of coronary flows remains limited in clinical practice due to the insufficient definition of conventional ultrasound, the motion artefacts of the myocardium, out-of-plane flow and complex anatomy of coronary arteries (Hozumi et al 1998, Fiorentini et al 2018).
In the last decade, ultrafast Doppler imaging using plane wave emissions has enabled quantitative blood flow estimation at high frame rate over large field of views (Bercoff et al 2011, Tanter and Fink 2014). Ultrafast Doppler was also shown to increase strongly the sensitivity of Doppler imaging and was used to image the blood flow variation in small vessels of animals brain (Macé et al 2011). Based on these developments, we introduced recently a framework called Ultrafast Doppler Coronary Angiography (UDCA) (Maresca et al 2018b) in order to visualize the coronary vasculature in a beating heart with high temporal and spatial resolution. Visualization of both large epicardial and small intramyocardial vessels (down to 100 µm of diameter) was demonstrated in the beating heart of large animal models and in patients. This work was entirely based on 2D ultrasound ultrafast imaging which remained limited when imaging the complex tri-dimensional vascular network of coronary arteries. More importantly, 2D UDCA did not allow the quantification of the absolute coronary flow rate due to the angular dependence of axial Doppler estimates. To solve this limitation, we propose here to extend the UDCA approach to 3D in order to perform absolute flow velocity estimation by 3D vector Doppler approaches (Correia et al 2016, Holbek et al 2017).
In this study, we introduce 3D ultrafast Doppler coronary angiography (3D UDCA) to assess the coronary flow quantitatively, in three-dimensions and non-invasively. The objectives of this study were (1) to establish the experimental methods for coronary volumetric blood flow imaging, (2) to demonstrate the in vivo feasibility in open-chest swine experiments and (3) to evaluate the accuracy of the technique to quantify the absolute flow rate in large coronary arteries. Finally, we investigated on a model of coronary stenosis the potential of the technique to provide non-invasively information on the local flow acceleration.
2. Materials and methods
2.1. 3D ultrafast imaging
3D ultrafast plane wave imaging was implemented in this study to provide volumetric acquisitions at a volume rate of 1000 volumes s−1. The 3D ultrafast ultrasound sequence was designed to (1) image the coronary vasculature anatomy by Power-Doppler Imaging and (2) assess the absolute flow velocities by vector Doppler Imaging. The parameters of the imaging sequence were chosen to optimize the imaging contrast, the signal-to-noise-ratio and the volume rate for coronary blood flow imaging.
A customized, programmable, 1024-channel ultrasound system and a matrix-array probe (32 × 32 elements, 8 MHz, 0.3 mm element size-pitch, 60% bandwidth, Vermon, Tours, France) were used. The ultrasound system prototype is composed of four 256-transmit/128-receive electronic channels initially designed to perform 2D ultrafast imaging (Supersonic Imagine, Aix-en-Provence, France), that are assembled, synchronized and multiplexed. Interested reader on this ultrasound prototype development can refer to (Provost et al 2014).
The sequence was based on 2D tilted plane-waves transmitted at high repetition rate. Each 2D tilted plane-wave was defined by a pair of angles in the x- and y- directions of the matrix-array probe (considering a Cartesian coordinate system). In all acquisitions, we used the repetition of Na = 4 plane wave emissions with the following angles: (−7°, 0°), (7°, 0°), (0°, − 7°), (0°, 7°). The angles were chosen as large as possible for increasing the accuracy of vector Doppler estimates. Each emission angle was repeated twice, in order to acquire the backscattered data on the two receive apertures of 512 elements each. The Pulse Repetition Frequency (PRF) was 8000 Hz, and the acquisitions lasted 0.6 s. The acquisitions were synchronized with the ECG-signal and trigged at the T-wave to cover the diastolic phase of the swine cardiac cycle. A summary of the imaging sequence application in vivo is presented in figures 1(A) and (B).
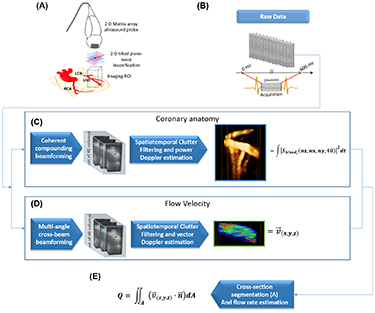
Figure 1. Coronary flow rate estimation with 3D UDCA. (A) Series of open-chest swine experiments were performed using a 4D ultrafast ultrasound scanner and 2D matrix-array probe. (B) Ultrafast acquisitions were performed during diastole and the raw backscattered signals were recorded. (C) Off-line Power Doppler processing was performed to visualise the coronary anatomy. (D) Vector Doppler processing was performed to compute the absolute flow velocity. (E) After segmentation of the vessel cross-section, the flow rate was computed by spatial integration of the flux.
Download figure:
Standard image High-resolution image2.2. Post-processing
The post-processing analysis was performed off-line. The raw RF data were processed by two different algorithms: one for power Doppler estimation in order to provide an image of the coronary anatomy and a second algorithm for vector Doppler estimation to assess the absolute flow velocity. The flow rate was then computed by integrating the velocity over a cross-sectional area of the coronary vessel. A complete workflow diagram with the description steps of the 3D CUDA is presented in figure 1. The analysis was computed with a Matlab (2015a, The MathWorks Inc., USA) running on a windows 10 desktop computer with Intel Xeon E5-2637 v2 CPU, 128GB of RAM, and K5200, NVidia GPU. A total post-processing time of 8 min was necessary for the entire computing. 3D rendering of the B-mode volumes, 3D Power Doppler and vector flow velocity were performed using the volren functions of the Amira software (6.0.1, Visualization Sciences group, USA).
2.2.1. Power Doppler estimation
The volumetric dataset was reconstructed using a volumetric delay-and-sum beamforming algorithm (Provost et al 2014) implemented in cuda language and computed on GPU (K5200, NVidia, USA). A complete volume of IQ data was reconstructed for each receive on a 3D grid of size [Nz,Nx,Ny] with Nz = 190 the number of samples along depth (35mm depth), Nx = 32, Ny = 32 in x- and y-directions. The spatial sampling was 0.2 mm along the depth, and 0.3 mm in the lateral directions. Coherent compounding was performed using the coherent summation of the received signals for each of the four emission angles. The dimension of the beamformed dataset was [Nz,Nx,Ny,Nt], with Nt the number of temporal samples. The dataset was divided into small sliding windows (figure 1(C)) of 40 temporal samples (40ms duration). The sliding windows were shifted by four temporal samples.
Clutter filtering of each small dataset was performed by using the spatio-temporal singular value decomposition (SVD) method (Demené et al 2015) by expanding the approach developed in 2D-UDCA (Maresca et al 2018a) to volumetric imaging. In brief, the data were rearranged in a 2D Casorati matrix with spatial and temporal dimensions, and the SVD was performed to determine the singular spatial and temporal vectors. A cut off value was determined for each window by the adaptive method developed previously to remove the vectors associated to the tissue signals (Maresca et al 2018a). The data were then rearranged to the original volume dimensions. After clutter filtering, the magnitude of the IQ signals was squared and averaged over time and the resulting matrix was rearranged into the original dimension [Nz,Nx,Ny] in order to provide the power Doppler image.
2.2.2. Vector flow velocity estimation
3D Vector Doppler estimation was performed at each voxel of the reconstructed grid. The technique was based on 3D ultrafast imaging acquisitions with plane-wave insonification, followed by a 2D multi-angle cross-beam beamforming, and 3D vector-Doppler velocity estimation through a least-squares approach (Correia et al 2016). The RF signals were first beamformed by adjusting the receive sub-apertures for each pixel. 9 receive angles were used (0°, 0°), (7°, 0°), (−7°, 0°), (0°, − 7°), (0°, 7°), (7°, 7°), (−7°, 7°),(−7°, − 7°),(7°, − 7°). The dimension of the subaperture was adjusted to ensure a f/d ratio of 5. It defined a set of 36 different transmit/receive angles combinations. Each dataset was [Nz,Nx,Ny,Nt] The dataset was then divided into small sliding windows of 40 temporal samples (40ms duration) and was filtered using the SVD approach used in the previous section. The Kasai estimator was then performed on each filtered dataset for velocity estimation and a least-square estimation was performed to derive the vector velocity components. For more details on this vector Doppler approach, the reader can refer to (Correia et al 2016).
2.2.3. Flow rate estimation
The 3D Power-Doppler volumes were used to manually delineate the coronary vessel (region-of-interest, ROI) on each of 32 successive 2D slices of the volume. Axial slices in the direction (x–z) or (y–z) were arbitrarily chosen depending on the vessel orientation to define a cross-sectional area of the vessel. The flux (i.e. the rate of flow per unit area) was then computed as the dot-product between the vector flow velocity and the normal vector to the cross-sectional area for each voxel. For each slice, the flow rate was then computed by integrating the flux over the cross-sectional area of the vessel (figure 1(D)). Finally, the flow rate was averaged over the different slices.
2.3. Animal protocol
Five 20–25 kg domestic swine (Sus scrofa domesticus) were anesthetized with isoflurane-2%, intubated and ventilated. After sternotomy, the pericardium was opened. A coronary flowmeter probe (Transonic, Ithaca, New York) was placed around the left ascending artery (LAD) and alongside the matrix-array probe was placed on top of the left-ventricle in the region perfused by the LAD (figure 1(A)). The coronary flow rate was recorded and time registered with the ultrasound acquisition
The acoustic transmission was obtained by filling the retracted sternum incision with sodium chloride solution.
Three sets of experiments were conducted:
- a.Baseline: a small portion of the Left Anterior Descending (LAD) artery was imaged on the heart of five animals.
- b.Reactive hyperemia: a full occlusion of the proximal LAD was performed during 30 s, 60 s and 90 s, and re-opened to induce reactive hyperemia in five animals. Coronary flows were imaged at the peak of hyperemia.
- c.Coronary stenosis: various levels of stenosis (30%, 50% and 70%) were applied to the proximal LAD of 3 animals using an externally inflatable pneumatic cuff occluder positioned around the artery.
The animal experiments protocol was approved by the local Institutional Animal Care and Use Committee (ComEth ANSESENVA- UPEC, approval APAFIS#5282-20160407l5203219)
3. Results
3.1. 3D UDCA imaging during diastole
The coronary flows were assessed throughout the diastolic phase. Figure 2 shows the 3D reconstruction at late systolic, early diastolic, mid diastolic and late diastolic phases. Venous coronary flows are observed during late systole (figure 2(a)). The transition between venous and arterial flows occurs rapidly at the beginning of the diastole and only arterial flows are observed at the early diastole (figure 2(b)) before myocardial relaxation. During the myocardial relaxation, rapid tissue motion occured and the tissue signal was not efficiently filtered out (figure 2(c)). Finally, at the end of the diastolic phase, tissue velocity decreased and the coronary flows were successfully reconstructed (figure 2(d)). Supplemental movie 1 (available online at stacks.iop.org/PMB/65/105013/mmedia) shows an example of the complete dynamics from end-systole to end-diastole.
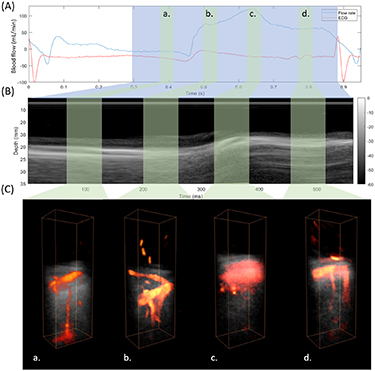
Figure 2. 3D Coronary flow imaging during diastole. (A) Phasic coronary artery blood flow measured by the coronary flow probe placed on the LAD. The blue area shows the ultrafast acquisition temporal window. The green areas show the time position of power Doppler reconstructions at late systole (a) early diastole (b) mid diastole (c) and late diastole (d). (B) Time-motion (TM) profile at the center of the imaged volume. The acquisition covers the end of the systolic phase and the entire diastolic phase. (C) 3D Power Doppler: Venous flow are mostly shown at phase (a), whereas arterial flows are shown at phase (b). During the myocardial relaxation the power Doppler was not correctly reconstructed because of the rapid tissue motion (c). Arterial flows are then reconstructed at the end of the diastole (d).
Download figure:
Standard image High-resolution image3.2. Absolute flow velocity profiles
Vector Doppler analysis (4D ultrafast ultrasound flow imaging) was also applied on the data in order to assess the absolute flow velocity in the large vessels. Figure 3 shows the power Doppler reconstruction in the LAD region and the corresponding absolute velocity in the artery (figure 3(B)). The velocity distribution is represented by flow streamlines. A maximal velocity of approximately 15 cm s−1 was found in the middle of the artery with the velocity decreasing toward the edges.
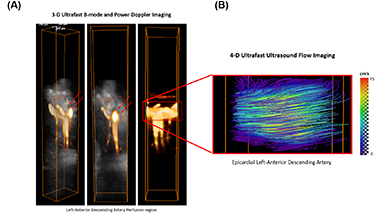
Figure 3. Power-Doppler volumes overlaid on B-mode anatomic volumes of the myocardium in the left-ascending artery (LAD), (A). Absolute flow velocities were estimated by 4D ultrafast ultrasound flow imaging on the LAD (B).
Download figure:
Standard image High-resolution image3.3. Evaluation of reactive hyperemia
The coronary blood flows were assessed during early diastole at baseline and after a transient occlusion of the LAD artery during 30, 60 and 90 s. After the flow was restored, the blood flow increased due to reactive hyperemia and the acquisition was performed when the peak of the blood flow measured by the invasive flow-meter was reached. Figure 4 shows the coronary absolute velocities at baseline and during reactive hyperemia. Maximal flow velocity increased from about 12 cm s−1 to more than 20 cm s−1. It corresponded well to the flow rate increase from about 70 ml min−1 in baseline to 120 ml min−1 during reactive hyperemia.
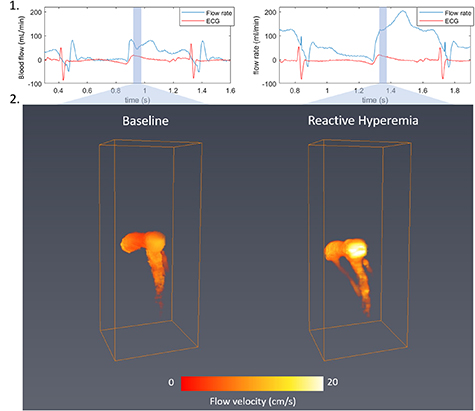
Figure 4. Coronary flow at baseline (left) and during reactive hyperemia (right). Absolute flow velocity mapping using 3D UDCA at early diastole.
Download figure:
Standard image High-resolution image3.4. Evaluation of coronary stenosis
We evaluated the ability of 3D UDCA to visualize a coronary stenosis of the LAD by imaging the location of the partial occlusion. Figure 5 shows a 50% stenosis imaged by 3D UDCA. Power-Doppler volumes are overlaid on B-mode anatomic volumes of the myocardium in the stenosis region. The Power-Doppler signal in the stenosis was reduced, demonstrating a reduction of the epicardial diameter. The flow velocities were estimated by vector Doppler and a significant flow acceleration was found in the center of the stenosis with maximal velocity of approximately 20 cm s−1.
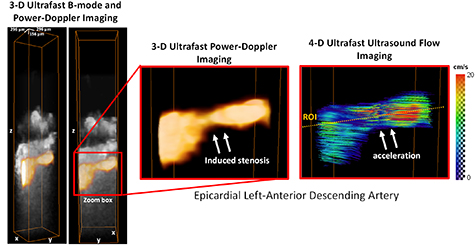
Figure 5. Epicardial LAD stenosis. Power-Doppler volumes overlaid on anatomical B-mode volumes show the induced stenosis and 4D ultrafast ultrasound flow imaging show the induced flow acceleration at the center of the stenosis.
Download figure:
Standard image High-resolution image3.5. Flow rate estimation
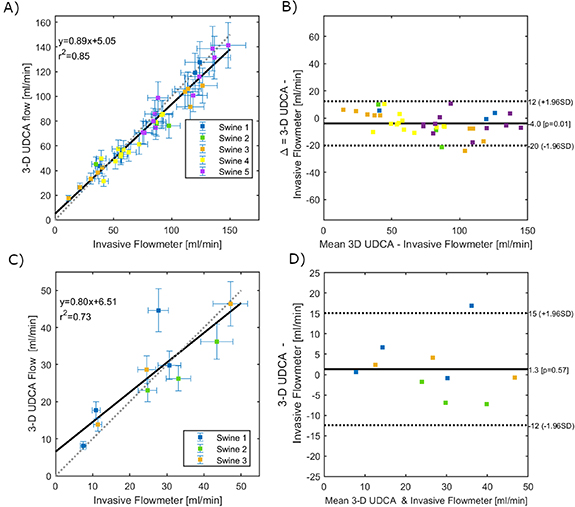
The UDCA flow rate estimation was compared to the invasive flowmeter measurements positioned on the LAD at a proximal location, close to the ultrasound matrix-array probe. All the group of experiments were included i.e. at baseline, at peak reactive hyperemia and during stenosis. The coronary flow rate measured at early-diastole by 3D UDCA was compared to the flowmeter measurement during the same time on the same heart beat. These results are presented in figure 6. Figure 6(A) shows a good agreement between 3D UDCA flow rate and flowmeter measurements during hyperemic response. A strong correlation between both measurements was found (mean r2 = 0.84 for N = 5 swine), supported by a Bland-Altman analysis (figure 6(B)). Figure 6(C) shows also a good agreement of 3D UDCA flow rate and flowmeter measurements during coronary stenosis. A strong correlation between both measurements was found (mean r2 = 0.73 for N = 3 swine), supported by a Bland-Altman analysis (figure 6(D)).
Figure 6. Comparison between Volumetric Flow Rate estimation by 3D UDCA and invasive flowmeter measurements (A and B) shows a good agreement for the series of experiments with increasing flow rates (i.e. during baseline and reactive hyperemia of epicardial LAD). (C) and (D) show also a good agreement for the series of experiments with decreased flow rates (i.e. during different degrees of epicardial LAD stenosis).
Download figure:
Standard image High-resolution image
4. Discussion
In this study, we introduced 3D UDCA imaging to image the coronary vasculature in three-dimensions and quantify the absolute coronary volumetric flow rates non-invasively by ultrasound in a beating heart. We demonstrated that 3D UDCA can image epicardial and intramural coronary vasculature in the beating heart of an open chest porcine model (N = 5) at high temporal and spatial resolution in three dimensions. 3D UDCA was performed during diastole in a single heart beat, allowing single vessels tracking in the probe's field-of-view. Coronary arterial flow visualization with 3D UDCA was found efficient when myocardial tissue motion remained limited, i.e. at early diastole before myocardial relaxation and at end-diastole. Likewise 4D ultrafast ultrasound flow imaging allowed the quantitative evaluation of volumetric velocity flow distribution in epicardial LAD. Flow velocities measured by 3D UDCA in the LAD were in agreement with the velocities published in the literature for the human heart (Hozumi et al 1998, Khanmohammadi et al 2019). Moreover, the flow rates estimated by 3D UDCA were in a good agreement with the measurements performed by a gold-standard and invasive flowmeter (r2 = 0.84 for total occlusion/reactive hyperemia experiments and r2 = 0.73 for stenosis experiments).
In an earlier study, we established that epicardial and intramural coronary vasculature compartments could be imaged by ultrafast ultrasound imaging in vivo and in humans non-invasively by UDCAin two-dimensional slices (Maresca et al 2018b). Translating this technique to volumetric imaging allowed us to overcome the main limitations of 2D UDCA, such as, the out of plane motion which makes it difficult to track vessels during the cardiac cycle. Moreover, volumetric imaging was combined to vector Doppler estimation which enabled us to perform absolute flow rate measurements. 3D UDCA have therefore a major clinical potential as a new non-invasive tool for functional imaging of the large epicardial arteries. 3D UDCA could therefore offer a non-ionizing and portable tool for the non-invasive exploration of the anatomy and function of major coronary arteries.
3D-UDCA could also offer a non-invasive way to assess the coronary flow reserve (CFR) which measures the ratio of flow during vasodilation and during resting conditions. Moreover, direct measurement of velocity acceleration in the stenosis region could provide a non-invasive way to estimate the pressure gradient through the stenosis and therefore the FFR which measures the ratio of distal to proximal pressures across the stenosis to determine the likelihood that the stenosis impedes oxygen delivery to the myocardium.
Flow estimation was validated on the epicardial LAD to allow the comparison with an invasive flowmeter but also because clinical applications focus currently on the assessment of the larger arteries. Absolute volumetric flow rate estimation on smaller intramyocardial arteries may be less accurate, due to the limitation in spatial resolution and contrast to noise ratio. Moreover, volumetric flow rate estimation required the segmentation of the vessel, which was performed manually using the volumetric Power-Doppler maps. Errors on the vessel segmentation could result in significant error flow. Ongoing work includes the development of an automatic segmentation algorithm adapted to the coronary vasculature application in order to reduce the user dependency.
Another limitation of the study is the opened-chest setting. This was required to implant the invasive flowmeter and occluder on the LAD. Open chest configuration also offered optimal imaging conditions which was ideal for this proof of concept study (lower depth and higher signal-to-noise ratio). Translation to human patients will require to implement this technique for transthoracic or transesophageal imaging settings. The transthoracic application on human patients is however expected to be more challenging with lower SNR and spatial resolution and its feasibility remains to be demonstrated. Expected limitations of transthoracic imaging include a decrease of image contrast and resolution as well as decrease of the sensitivity due to low signal to noise ratio. The decrease of lateral resolution could become a major issue at large depth. In this study we placed the coronary artery at a depth of 35 mm because our matrix probe has a limited aperture of 9.6 × 9.6 mm2 and is not designed for larger depth. Imaging the LAD with conventional transthoracic echocardiography has been shown feasible in human patients at relatively low depths of a few centimeters (Watanabe et al 2001) which is comparable to the imaging depth used in the study. At larger depth, however, lateral resolution is expected to decrease and could become too limited to image correctly the coronary vessels of millimeters dimensions. Several solutions could be implemented to solve this problem, for instance a larger probe such as a matrix probe with a footprint of a conventional cardiac phased array would allow to increase the resolution but it would require more elements or to use dedicated integrated electronics. Harmonic imaging strategies could also be used to improve strongly the resolution and the contrast at large depth.
Finally, another important limitation is the dimension of the volume imaged which remains small for the exploration of the entire coronary vasculature. In order to image a larger sector field-of-view, 3D UDCA needs to be implemented using diverging-waves emissions instead of plane-waves which will reduce even more the signal-to-noise ratio, i.e. the imaging quality. Strategies, such as, coded emissions of multi-plane wave imaging may be required to improve the Doppler estimates in three-dimensions (Tiran et al 2015).
5. Conclusions
We introduced 3D UDCA imaging and demonstrated that the epicardial and intramyocardial coronary vasculature can be imaged in three-dimensions in open-chest swine. Absolute blood flow velocities and flow rates were estimated quantitatively using vector Doppler approach. Flow rate estimates were validated against an invasive gold-standard flowmeter during reactive hyperemia and stenosis of the LAD. The blood flow pattern was also imaged in a stenosed region. These results show the potential of 3D UDCA as a new non-invasive tool to evaluate normal and altered coronary flows.
Acknowledgment
This work was supported by the European Research Council under the European Union's Seventh Framework Programme (FP/2007–2013)/ERC Grant Agreement No. 311025.